We are still loving the new BSP, and use it extensively!
Lately I have been leveraging #shellcheck source … directives and the code completion and navigation capabilities that provides are a game changer for us.
One challenge we are starting to face is indexing performance. We have a pretty large BASH function library that we are tying into, admittedly not your average kind of ‘little bit of BASH’ projects. When I make a simple change to a script I see the CPU jump and stay up, for as much as 30 seconds or more. While this background processing is going on, while I can still type and edit there is no longer any code completion or error checking going on.
This is not an occasional thing, it happens each time I edit a file. I am sure it is because of the large amount of back referenced code that the BASH checker must grind its way through in order to finish validation and parsing, but it is becoming a usability problem. Maybe there is something we can do to improve things? The vast bulk of the BASH libraries change rarely, maybe there is some kind of parse cache alternatives?
Hi Jay,
thanks for reporting. This definitely isn’t the way how it’s supposed to be.
The plugin is supposed to support large source sets and I’ll do my best to improve this.
When your typing into the editor, the plugin performs steps like resolving variables and functions. This uses all previously sourced files and also all files, which source the current file. An index is used to make this fast, but it’s obviously not doing well with your project.
A few questions:
Are the sources public? If yes, then I’d test and profile this myself. But I’m assuming that this isn’t possible.
Can you tell how large your Bash codebase is, e.g. lines of code and number of files?
Is the high CPU usage only found when typing into a large file or also when typing into a small file, which sources your bash function library?
Anything else seeming wrong, e.g. exceptions popping up? Had you noticed things like a StackOverflowException?
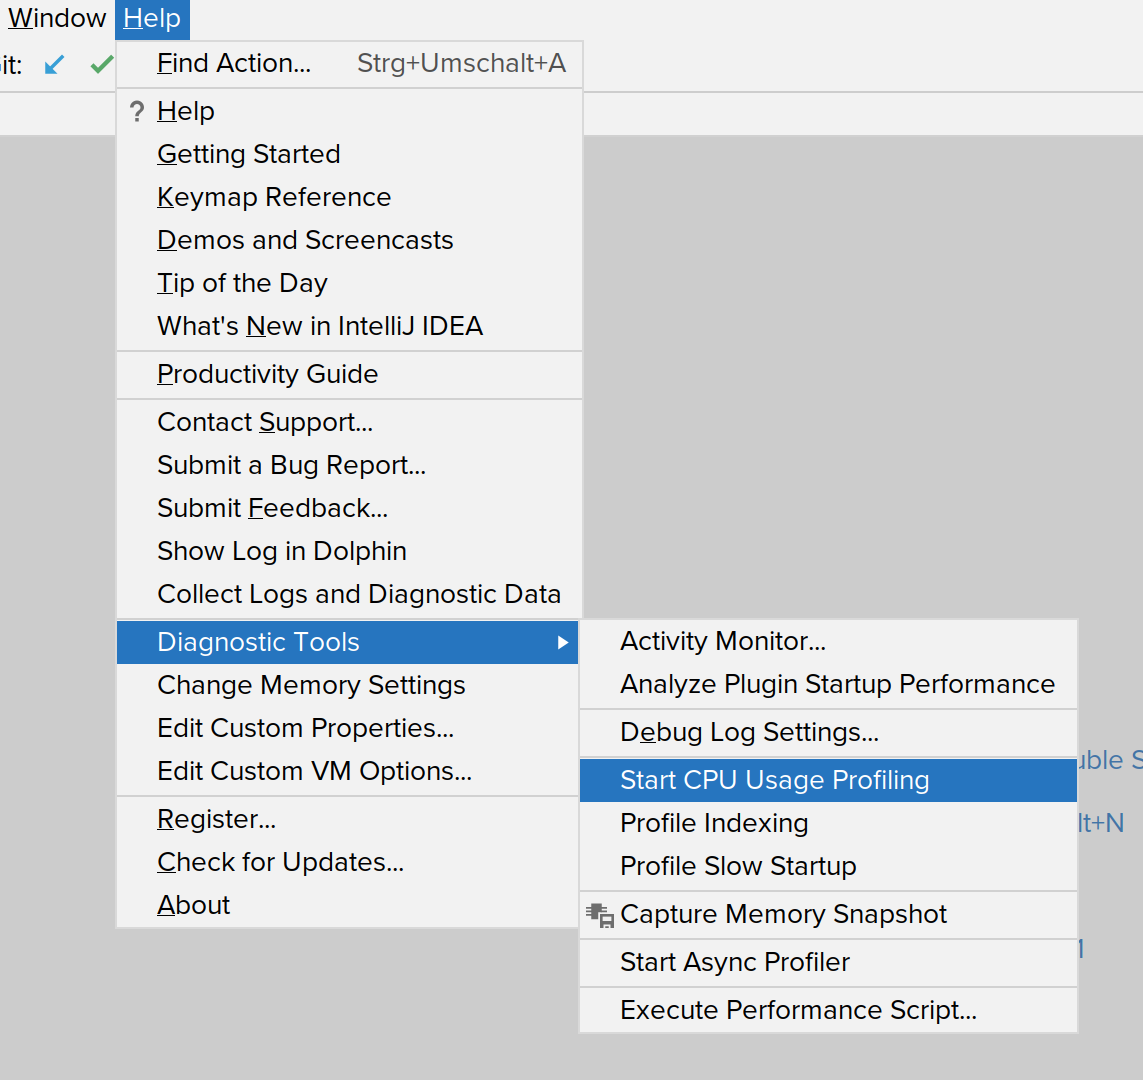
I sent an email with some CPU profiling and debug logs.
To answer your questions:
The sources are not public, but I included a small portion of some non-proprietary code in the email.
Our codebase for this project is perhaps 3000-5000 lines of BASH in about 15 files.
I can see heavy CPU usage when editing a BASH file only 20 lines long, with several include directives pulling in a large number of dependent functions
Nothing else seems wrong, no evidence of sickness.
To test while profiling/debugging, this is what I did:
opened a 30 line BASH script that used source include directives
selected a line that used a variable like this: “${beSeq}”
started profiling when the CPU was quiet
edited the line to remove the quotes
watched the CPU grind at high levels for about 40 seconds
saw a warning appear (use quoted variables to avoid word splitting)
ended profiling
One final thing - the library of BASH code is slurped up in a series of nested source include directives, in that when a single file is included, the included file has one or more includes of it’s own (and each subsequent include may include other include directives). So while the file I am editing may only have 1 include directive, there may be as many as 15 files that have to be scanned in order to complete the dependency traversal.
Thanks for looking into this so quickly! I am eager to hear what you might learn next.
Some of our BASH coders prefer NOT to us suffixes to identify their files. This admittedly causes some problems in other areas both in Linux and in Intellij, where file types are usually identified by suffix alone. You recently added the capability to recognize BASH files by looking for #shellcheck directives and/or hash bang lines in the file. This was a great feature that stopped our team’s ‘Suffix Wars’!
I don’t recall exactly when I started to see performance problems, but it has been a recent thing. Perhaps this new scanning feature is part of the problem?
Thanks for the details, that should help to track this down.
(I haven‘t received the email, the email provider (Google) might have rejected attachment data. I‘ll let you know with a better way to share the data when I need it.)
5000 lines of code shouldn‘t be an issue here, but I‘ll keep it in mind.
Files without extension are treated in the same way. IntelliJ is applying slightly more content scanning, but only when these files change.
A chain of source commands is supported, but a likely cause of this issue — especially with a non-trivial graph of dependencies. I‘ll look into this next week and hope to have a fix soon.
One more thing, your note about the warning appearing after cpu usage was back to normal might indicate an issue with ShellCheck. The more recent versions of the plugin pass -x To make ShellCheck look into sourced files.
You could try to run the latest version of ShellCheck as shellcheck -x file.bash and watch cpu usage.
I was using shellcheck 0.4.3, the latest available version is 0.7.1.
I updated to 0.7.1 and ran it using the -x option on the same file I used to test performance in IntelliJ, and the results came back in less that 1 second. I don’t think shellcheck itself is the performance bottle neck.
Just to get more information I tried removing the shellcheck include directives from my little test BASH script and then repeated the same edit test. Surprisingly, the CPU still jumped for a long time - maybe 20 seconds this time (instead of 40 seconds when there is included files). While this is an improvement there is clearly still some kind of issue, as my test script is only 30 lines of very simple BASH.
This boils down to a bunch of issues.
I’ve started to work on fixes, but it’s still unclear if these are fixing all of your problems.
BashSupport goes into files, which include the currently edited file. That’s needed to resolve variables declared in shared file and a few more things. That was most likely causing the CPU spikes of your last post.
I’d publish a snapshot version soon, if you wanted to give this a try. Are you on 2020.2?
Did you get my uploaded files? I did include one of our base libraries, it has a bunch of non-trivial BASH functions in them that should exercise parsers well.
The new version should perform much better now in projects with many sourced files.
I already have automated tests to parse the most popular GitHub shell projects, but performance tests were too few. I’ve tested this version with a project, which has 100+ files linked via source commands.
There’s a new setting at Settings > Languages&Frameworks > BashSupport Pro to control if the automatic completion popup should display items from files, which source the currently edited file. Enable this when you’re missing declarations in completions — or request completions by shortcut.
It’s off by default – but it might change for the public release.
If editing, code completion, etc, is still (too) slow for your project:
could you send me a new CPU snapshot, please?
do you see an improvement or none at all?
what hardware are you using? Slower machines or machines with few cores might be slowed down by ShellCheck running in the background. ShellCheck runs for a while for large files and/or files with many source commands.
Try to disable ShellCheck by turning off Settings>Editor>Inspections>BashSupport Pro>ShellCheck to see if it helps.
Are things better with File > Power Save Mode turned on?
Good news! What ever you changed in the EAP seems to have fixed things. I did the same test change as before. With the last plugin CPU jumped for 20-30 seconds and no check results appeared until the CPU went back down. Now, I make a change that should issue a warning in exactly the same place in the same file, and not only does the CPU not even flicker the warning I expect appears essentially instantly.
I’ve published version 1.5.12 on the stable channel. I had to change a few things of the original attempt, but also improved a few more slow pieces of the software. Overall, this version should be much better than 1.5.10. Thanks for providing feedback and support to test this!
I did notice a few hiccups here and there in your EAP, but I figured you were focusing on the performance issues first. The parser seemed to get confused in a few places, I am sure the polished stable version will be fine.
Thanks again for all your support in getting this to work. I have said it before, this plugin is a game changer in how to write clean, reliable and error-free BASH!
There was a bug in the eap, which prevented “go to declaration” (aka ctrl+click) on some variables, which is fixed in the stable version.
If you notice other regressions or bugs, please report it and I’ll see what I can do to fix it.
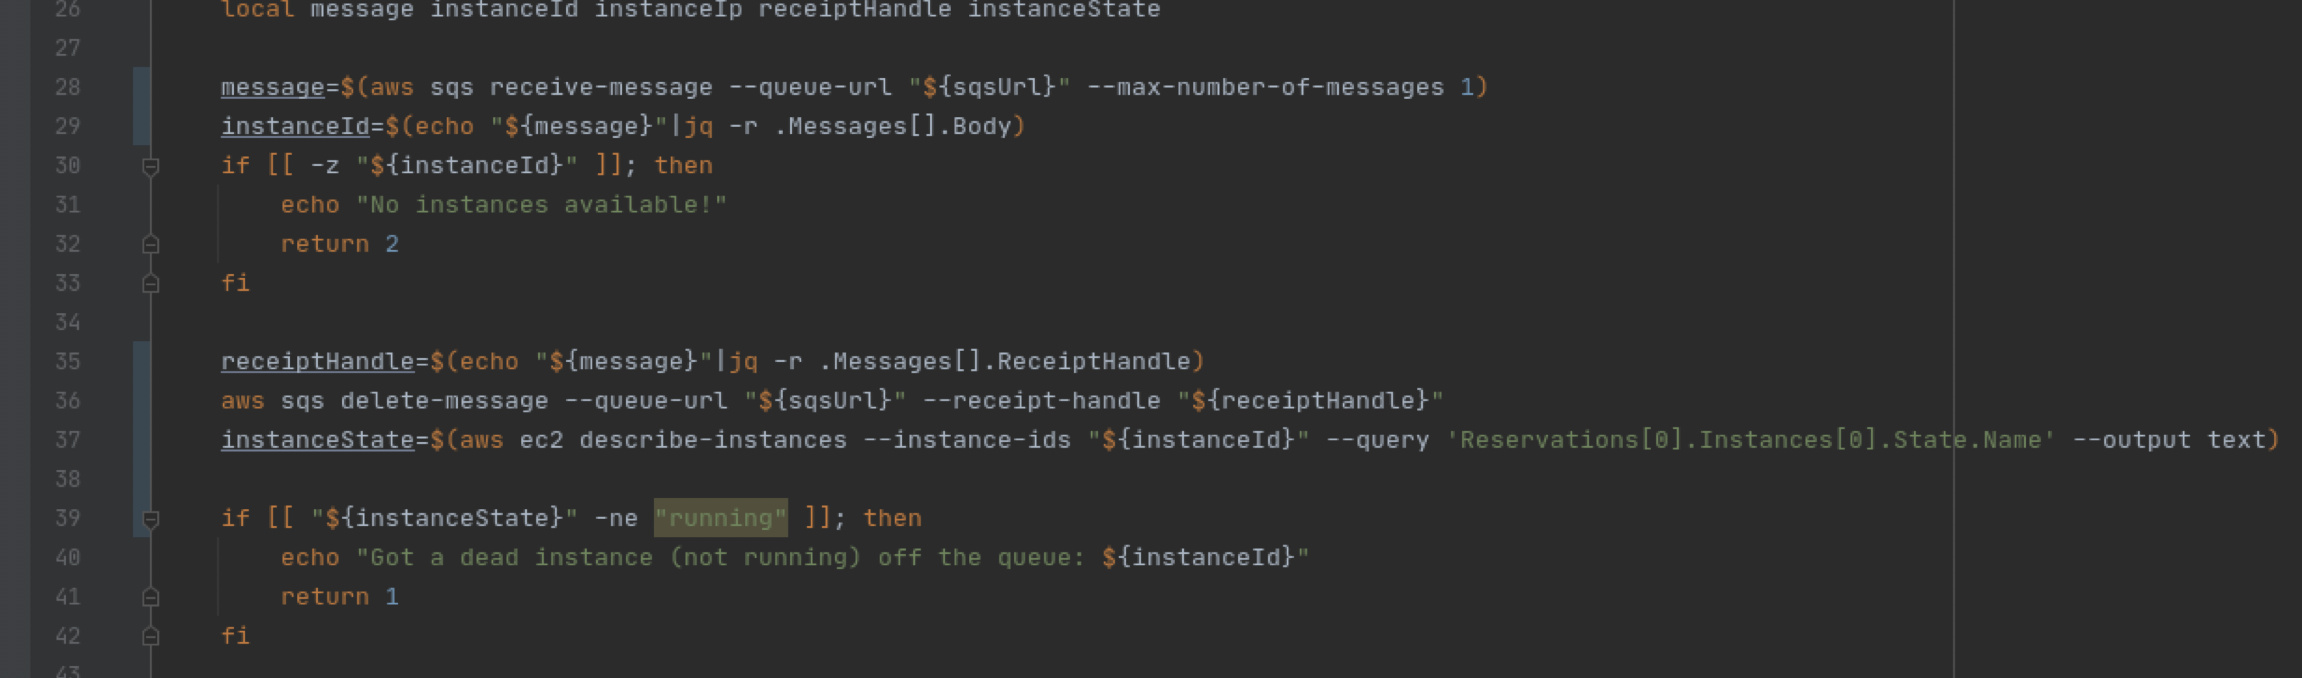
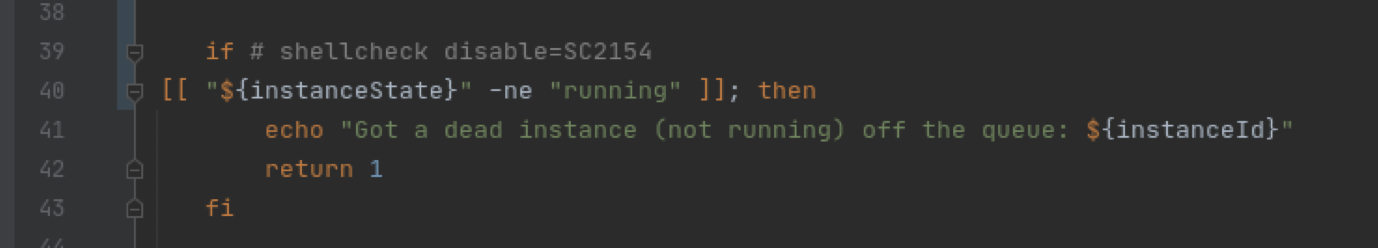
The highlighted code reports a SC2154, but it isn’t even a variable so how can it be unassigned, right? If I try to do an inline disable directive, I get this:
So the parser is not clear where to put the directive, in this case in the line above the directive.
I trimmed the code down to just this function in a single file, and it seems to still show the problem. Here is the actual code, maybe you can reproduce?
#!/usr/bin/env bash
# shellcheck disable=SC2155,SC1090,SC2164

function awsSqsQueueMsgRead()
{
    local sqsUrl="${1:?}"
    local message instanceId instanceIp receiptHandle instanceState

    message=$(aws sqs receive-message --queue-url "${sqsUrl}" --max-number-of-messages 1)
    instanceId=$(echo "${message}"|jq -r .Messages[].Body)
    if [[ -z "${instanceId}" ]]; then
        echo "No instances available!"
        return 2
    fi

    receiptHandle=$(echo "${message}"|jq -r .Messages[].ReceiptHandle)
    aws sqs delete-message --queue-url "${sqsUrl}" --receipt-handle "${receiptHandle}"
    instanceState=$(aws ec2 describe-instances --instance-ids "${instanceId}" --query 'Reservations[0].Instances[0].State.Name' --output text)

    if [[ "${instanceState}" -ne "running" ]]; then
        echo "Got a dead instance (not running) off the queue: ${instanceId}"
        return 1
    fi

    instanceIp=$(
        aws \
            ec2 \
                describe-instances \
                --instance-ids "${instanceId}" \
                --query 'Reservations[0].Instances[0].NetworkInterfaces[0].PrivateIpAddress' \
                --output text
                )

    if [[ ${instanceIp^^} == "NONE" ]]; then
        echo "Got a dead instance (no IP) off the queue: ${instanceId}"
        return 1
    fi

    cat - <<JSON
{
    "instanceId" : "${instanceId}",
    "hostname" : "ip.${instanceIp//\./-}.aws-test.local",
    "ip" : "${instanceIp}"
}
JSON
}
Well, welcome to the wonderful world of Bash scripting
You almost made me report this to ShellCheck (that’s where the warning is coming from), it’s definitely confusing…
When used with the [[ command, Arg1 and Arg2 are evaluated as arithmetic expressions
String comparision is actually [[ "${instanceState}" != "running" ]], comparing integers uses -ne and other operators (see man bash or help test).
This means that [[ 42 -ne running ]] is an integer comparison and equivalent to [[ 42 -ne $((running)) ]], which is a reference to a variable named running.
You can test this with:
# prints "not equal"
state=123; running=234; [[ "${state}" -ne "running" ]] && echo not equal || echo equal
# prints "equal"
state=123; running=123; [[ "${state}" -ne "running" ]] && echo not equal || echo equal
Write your code as [[ "${instanceState}" != "running" ]] for string comparison, and you’re good to go
(The wrong position of the inserted disable directive is a bug, I’ll fix that for the next update. The last update did not change here, so it shouldn’t be a new thing or a regression.)
 I am on the latest release, 2.2.3